November 01, 2025
Authors: B. Hekiert, A. Prokopczyk, J. O’Driscoll, P. Guzik
Institutions: Adam Mickiewicz University (Poland), University of Leicester (UK), Poznań University of Medical Sciences
Publication: Life 2025, 15, 1622
Date: October 2025
The study starts with the premise that fencing is an Olympic combat sport that requires an exceptional combination of technical skills, tactical decisions, and physical conditioning, featuring unique asymmetrical movements and an intermittent activity profile.
Research Objectives:
To compare elite and non-elite fencers on:
Endurance capacity and heart rate responses
Explosive power
Explosive acceleration
Relative lean mass (body composition)
To examine the relationship between competitive experience and physiological profiles
Study conducted on 49 Polish male fencers
Inclusion criteria:
Exclusion criteria:
Group division:
Period: Summer 2022, during the national training camp preparation period
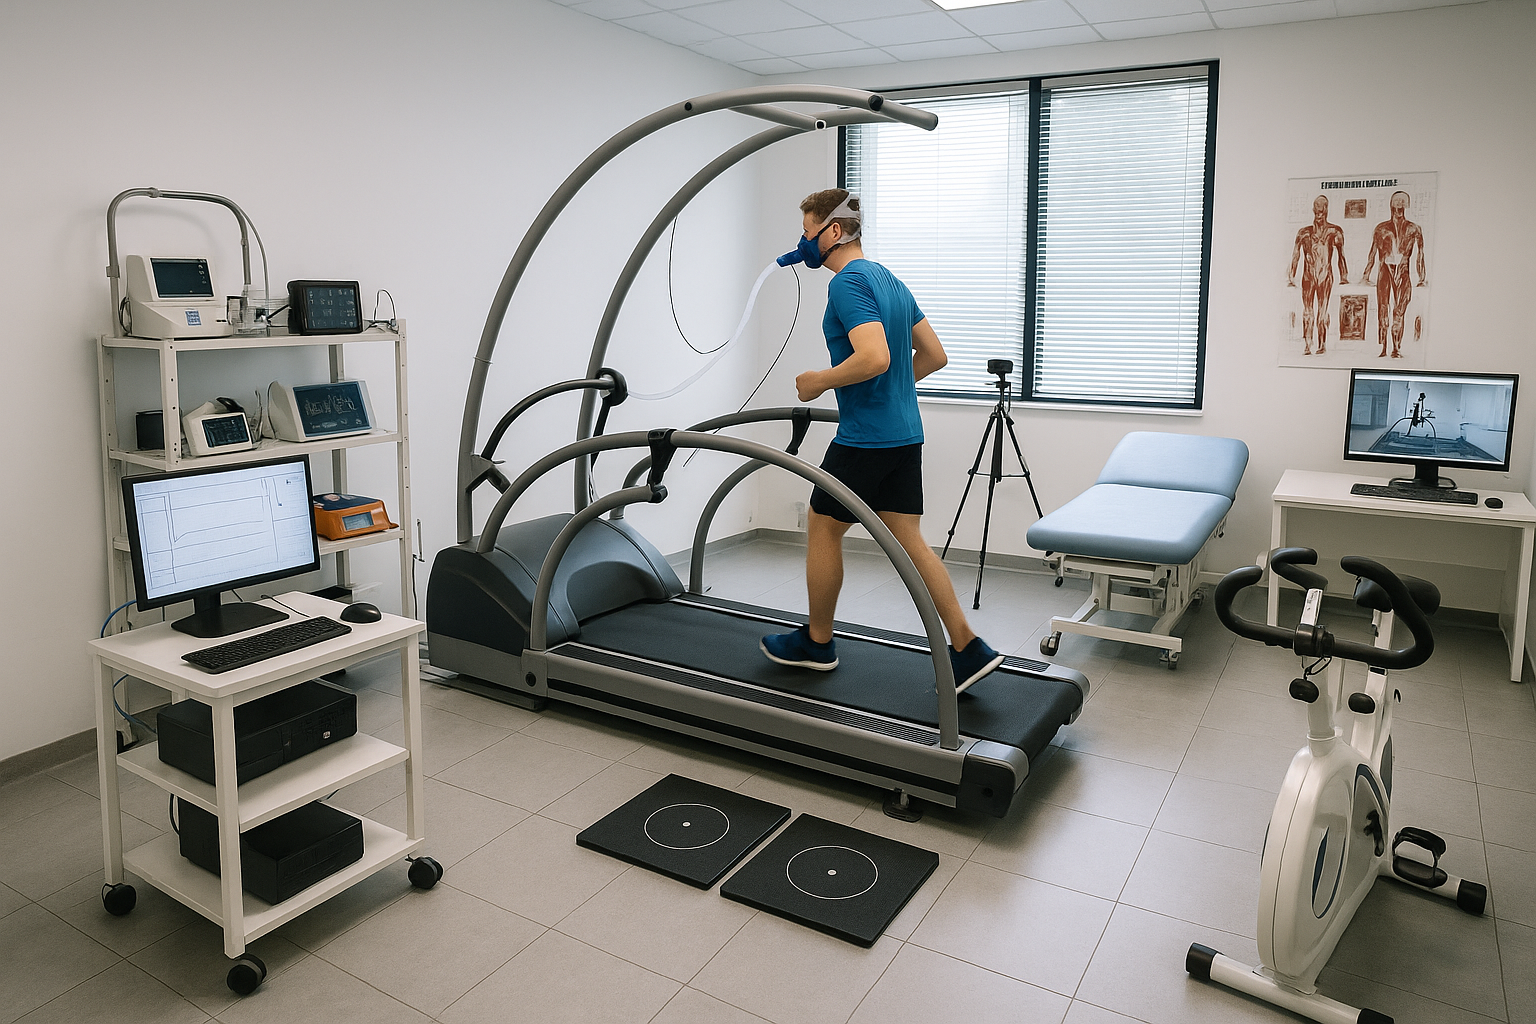
Test characteristics:
Progressive protocol:
Recorded parameters:
Protocol:
Measurement system: OptoGait (Microgate, Bolzano, Italy)
Measured parameters:
Protocol:
Measurement:
Main parameter:
Measurement points:
Temporal order (in a single morning session):
Methods used:
| Parameter | Non-Elite (n=33) | Elite (n=16) | p-value |
|---|---|---|---|
| Age (years) | 17.0 (15.6-18.2) | 21.0 (19.2-24.9) | <0.0001 |
| Height (cm) | 179.0 (174-183) | 183.5 (180.3-188) | 0.0019 |
| Weight (kg) | 69.0 (62.7-77.6) | 79.6 (72.8-82.0) | 0.0026 |
| BMI (kg/m²) | 21.4 (19.5-24.0) | 23.5 (21.6-24.3) | 0.0901 |
| Experience (years) | 9.0 (7.0-10.0) | 13.0 (10.0-16.5) | <0.0001 |
| Parameter | Non-Elite | Elite | p-value |
|---|---|---|---|
| FET Duration (min) | 12.4 (12.1-13.3) | 15.0 (14.3-15.0) | <0.0001 |
| Pre-FET HR (bpm) | 127.0 (114.5-132.5) | 118.5 (110.5-125.8) | 0.046 |
| End-FET HR (bpm) | 198.0 (192-208) | 196.5 (191.8-201.5) | 0.2625 |
| HRR1 (bpm) | 161.0 (144-169.5) | 149.0 (140.5-157.8) | 0.0386 |
| RPE (Borg scale) | 9.0 (9.0-10.0) | 8.5 (8.0-9.0) | 0.001 |
Key Result: 56.25% (9/16) of elites vs 6.06% (2/33) of non-elites completed the full 15 minutes (p<0.0001)
| Parameter | Non-Elite | Elite | p-value |
|---|---|---|---|
| C_time (s) | 0.40 (0.27-0.53) | 0.31 (0.24-0.44) | 0.0511 |
| F_time (s) | 0.56 (0.54-0.58) | 0.62 (0.59-0.65) | <0.0001 |
| Peak Power (W/kg) | 30.20 (27.59-38.45) | 42.84 (36.40-48.17) | 0.0002 |
| Mean Power 4 CMJ (W/kg) | 27.74 (25.71-33.16) | 39.53 (35.39-44.54) | <0.0001 |
| Rhythm (jumps/s) | 1.10 (0.92-1.24) | 1.09 (0.94-1.23) | 0.7087 |
| RSI (m/s) | 0.85 (0.72-1.28) | 1.50 (1.07-1.73) | 0.001 |
| Parameter | Non-Elite | Elite | p-value |
|---|---|---|---|
| 5m Sprint (s) | 1.09 (1.06-1.13) | 1.10 (1.02-1.16) | 0.8895 |
| Relative lean mass (%) | 59.9 (54.9-64.6) | 67.6 (65.2-71.6) | 0.0004 |
Important Note: No significant difference in sprint, but notable difference (+7.7%) in relative lean mass
Estimated Median Differences (EMD) after adjustment for age and BMI:
| Parameter | EMD | SE | p-value |
|---|---|---|---|
| FET Duration (min) | +1.84 | 0.45 | <0.0001 |
| F_time (s) | +0.05 | 0.02 | 0.0050 |
| Peak Power (W/kg) | +10.38 | 4.23 | 0.0140 |
| Mean Power 4 CMJ (W/kg) | +10.92 | 3.99 | 0.0062 |
| Pre-FET HR (bpm) | +0.39 | 6.87 | 0.9550 |
| HRR1 (bpm) | -13.34 | 8.04 | 0.0970 |
| C_time (s) | -0.11 | 0.08 | 0.1583 |
Interpretation: Differences in FET and CMJ remain robust even after controlling for age and BMI
Significant Spearman correlations:
| Variable | Rho | p-value | Strength |
|---|---|---|---|
| FET Duration | 0.62 | <0.0001 | Strong |
| Relative lean mass | 0.55 | <0.0001 | Medium-Strong |
| F_time | 0.49 | 0.0003 | Medium-Strong |
| Body weight | 0.48 | 0.0005 | Medium |
| Height | 0.44 | 0.0015 | Medium |
| Mean Power 4 CMJ | 0.42 | 0.0029 | Medium |
| BMI | 0.38 | 0.0067 | Medium |
| Peak Power | 0.37 | 0.0081 | Medium |
| RSI | 0.35 | 0.0139 | Medium |
| Pre-FET HR | -0.50 | 0.0003 | Medium (Inverse) |
| RPE | -0.39 | 0.0056 | Medium (Inverse) |
NON-significant correlations:
Parameters with AUC > 0.80 (excellent discrimination):
| Parameter | AUC | p-value | Optimal Cut-off (Youden) | Sensitivity/Specificity |
|---|---|---|---|---|
| F_time (s) | 0.899 | <0.0001 | ≥0.581 | High/High |
| FET Duration (min) | 0.878 | <0.0001 | ≥14.3 | High/High |
| Mean Power 4 CMJ (W/kg) | 0.860 | 0.0001 | ≥34.93 | High/High |
| Experience (years) | 0.856 | <0.0001 | ≥10 | High/High |
| Peak Power (W/kg) | 0.837 | 0.0001 | ≥32.05 | High/High |
Parameters with AUC 0.70-0.80 (good discrimination):
| Parameter | AUC | p-value | Optimal Cut-off |
|---|---|---|---|
| RSI (m/s) | 0.793 | 0.0010 | ≥0.85 |
| RPE (points) | 0.767 | 0.0026 | ≤8 |
Parameters with poor discriminative power (AUC ≈ 0.5):